How to Spot The Graph Risks with Signals
Identify and monitor risk factors in your GRT holdings with health signals.
The Graph Risk Overview

The Graph is an indexing protocol and global API for organizing blockchain data and making it easily accessible with GraphQL. Developers can use Graph Explorer to search, find, and publish all the public data they need to build decentralized applications. The Graph Network makes it possible to build serverless dApps that run entirely on public infrastructure. GRT is the native token of the network that’s used to coordinate work. GRT is an ERC20 token. Node operators, called Indexers, stake and e...
Understanding The Graph Risk Signals
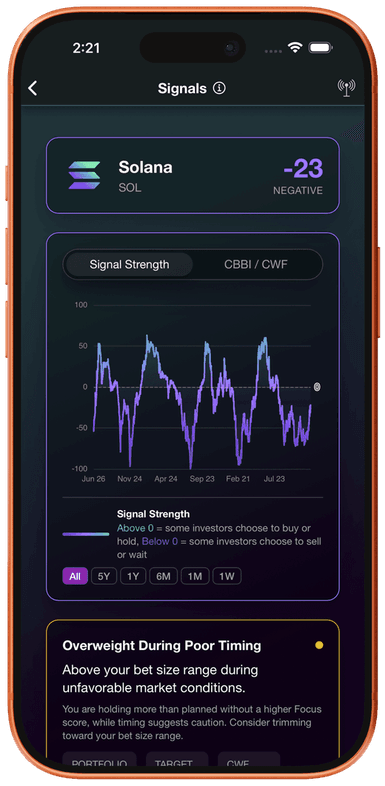
Fundamentally provides 7 types of risk signals to help you monitor your The Graph (GRT) position. These signals combine your Focus score, market timing (CBBI), and position sizing to alert you when conditions warrant attention.
Risk Signals for The Graph
- Concentration Risk: Your GRT position exceeds your bet size range
- Liquidity Risk: Your position is large relative to daily trading volume
- Volatility Risk: Large price swings combined with meaningful position size
- Focus-Timing Mismatch: High Focus but unfavorable market timing
- FOMO Risk: Good timing but low Focus score
- Cleanup Candidate: Very small position with low Focus
- Overweight Poor Timing: Above bet size range during unfavorable conditions
Volatility Context
The Graph currently exhibits stable price action with a 24-hour volatility of 0%. Volatility Risk signals help you understand when this volatility poses a risk to your position.
How Fundamentally Monitors The Graph Risks
View Your Signals
7 Risk SignalsOpen the Signals page to see which risk signals are active for The Graph. Each signal tells you specifically what risk is present in your GRT position.
Understand Each Signal
Clear ExplanationsConcentration Risk triggers when GRT exceeds your bet size range. Volatility Risk signals you to large price swings. Focus-Timing Mismatch warns when market conditions don't favor your position.
Take Informed Action
You DecideUse the Investment Calculator to determine how much The Graph to rebalance if needed. Signals are informational—you decide what action to take based on your strategy.
Concentration Risk
Signals when your GRT position exceeds the bet size range based on your Focus score.
Liquidity Risk
Monitors when your The Graph position is large relative to daily trading volume.
Volatility Risk
Tracks GRT price swings and signals when volatility affects your position.
Timing Signals
Combines your Focus for The Graph with CBBI market timing to identify mismatches.
Frequently Asked Questions
Fundamentally monitors 7 risk signals for The Graph: Concentration Risk, Liquidity Risk, Volatility Risk, Focus-Timing Mismatch, FOMO Risk, Cleanup Candidate, and Overweight Poor Timing. These combine your GRT Focus score, position size, and market conditions.
For The Graph, consider market risk, liquidity risk, technology risk, and team execution risk. Your GRT bet size should reflect your Focus score. Lower conviction means smaller positions to manage downside exposure.
Monitor The Graph Risk Signals
Stay informed about risks in your portfolio with Fundamentally's signal system.